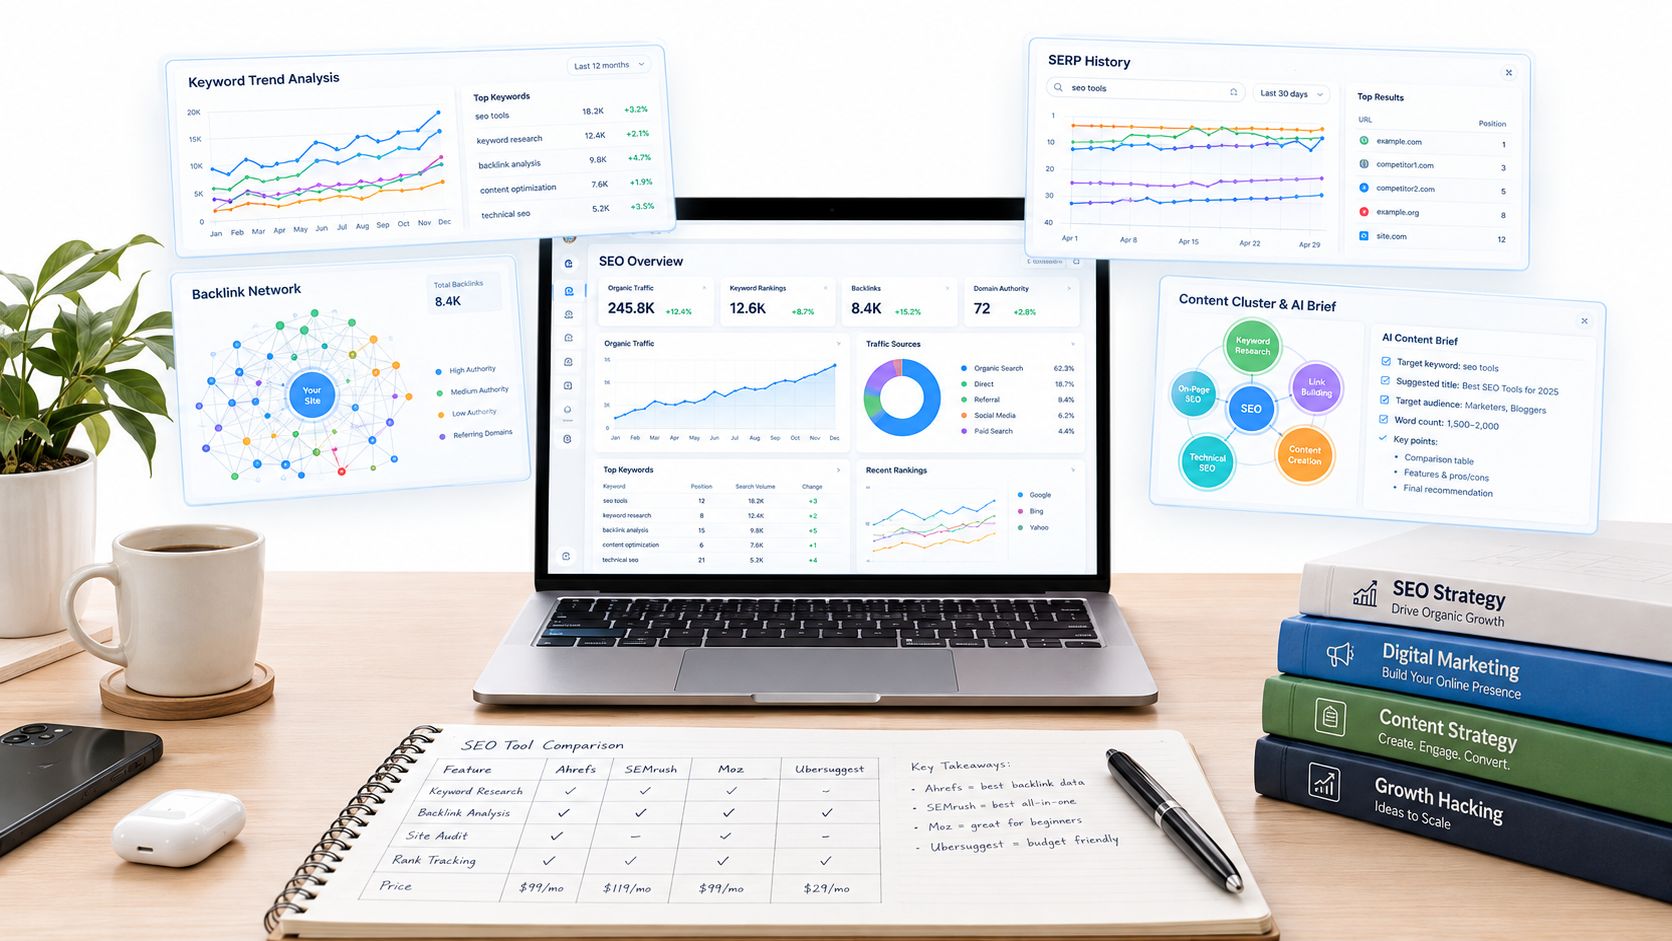
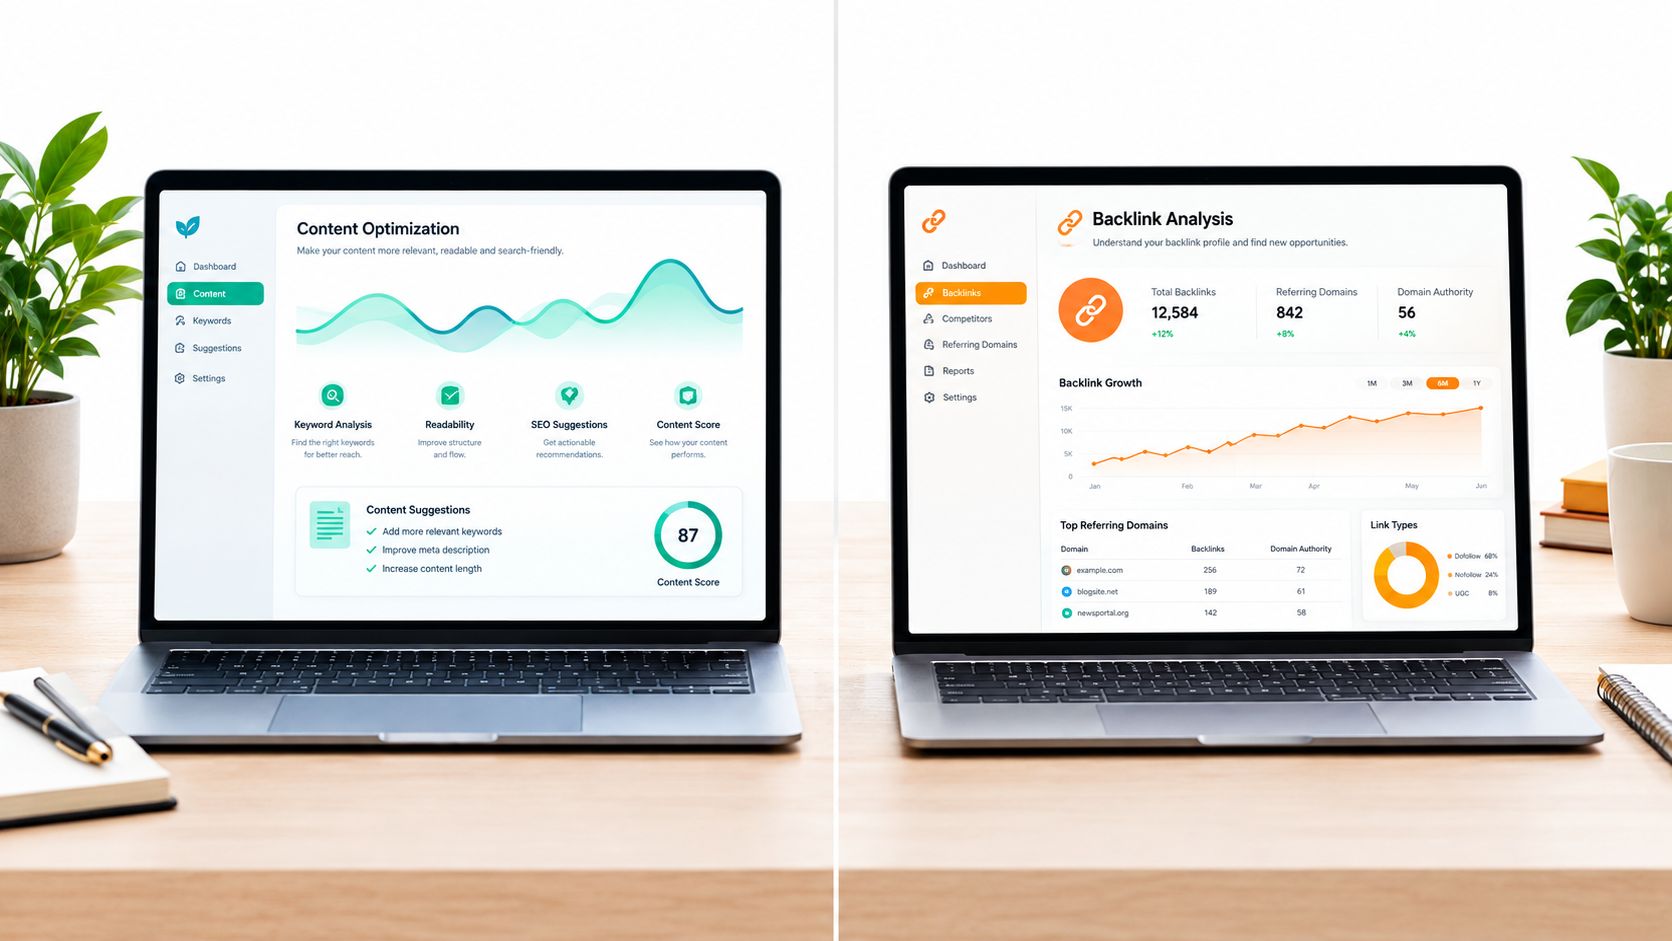
%20(1)-B86R08ZzwhPzS6UZbG3mSxRWPCwGwn.png)


The most popular advice about SEO reporting is also the reason many agency reports fail: build a polished dashboard, automate the refresh, and send it every month. A dashboard can display data, but it can't tell a client which decision to make, whether the apparent gain came from better relevance or higher demand, or why conversions changed after an attribution setting was modified.
I've won and lost retainers around this distinction. Clients don't retain an agency because it exported rankings on schedule. They retain the agency because the report explains what changed, why it matters, what remains uncertain, and who needs to act next. That requires a reporting system built around exceptions and decisions, not a monthly receipt of vanity metrics.
Tabla de contenido
- Why Standard Monthly Dashboards Fail Clients
- Locking Down Attribution and Baselines
- Diagnosing Traffic Shifts with Precision
- Reporting AI Overview Visibility Honestly
- Automating Competitor Intelligence with SemDash
- Building Exception-Based Action Registers
Why Standard Monthly Dashboards Fail Clients
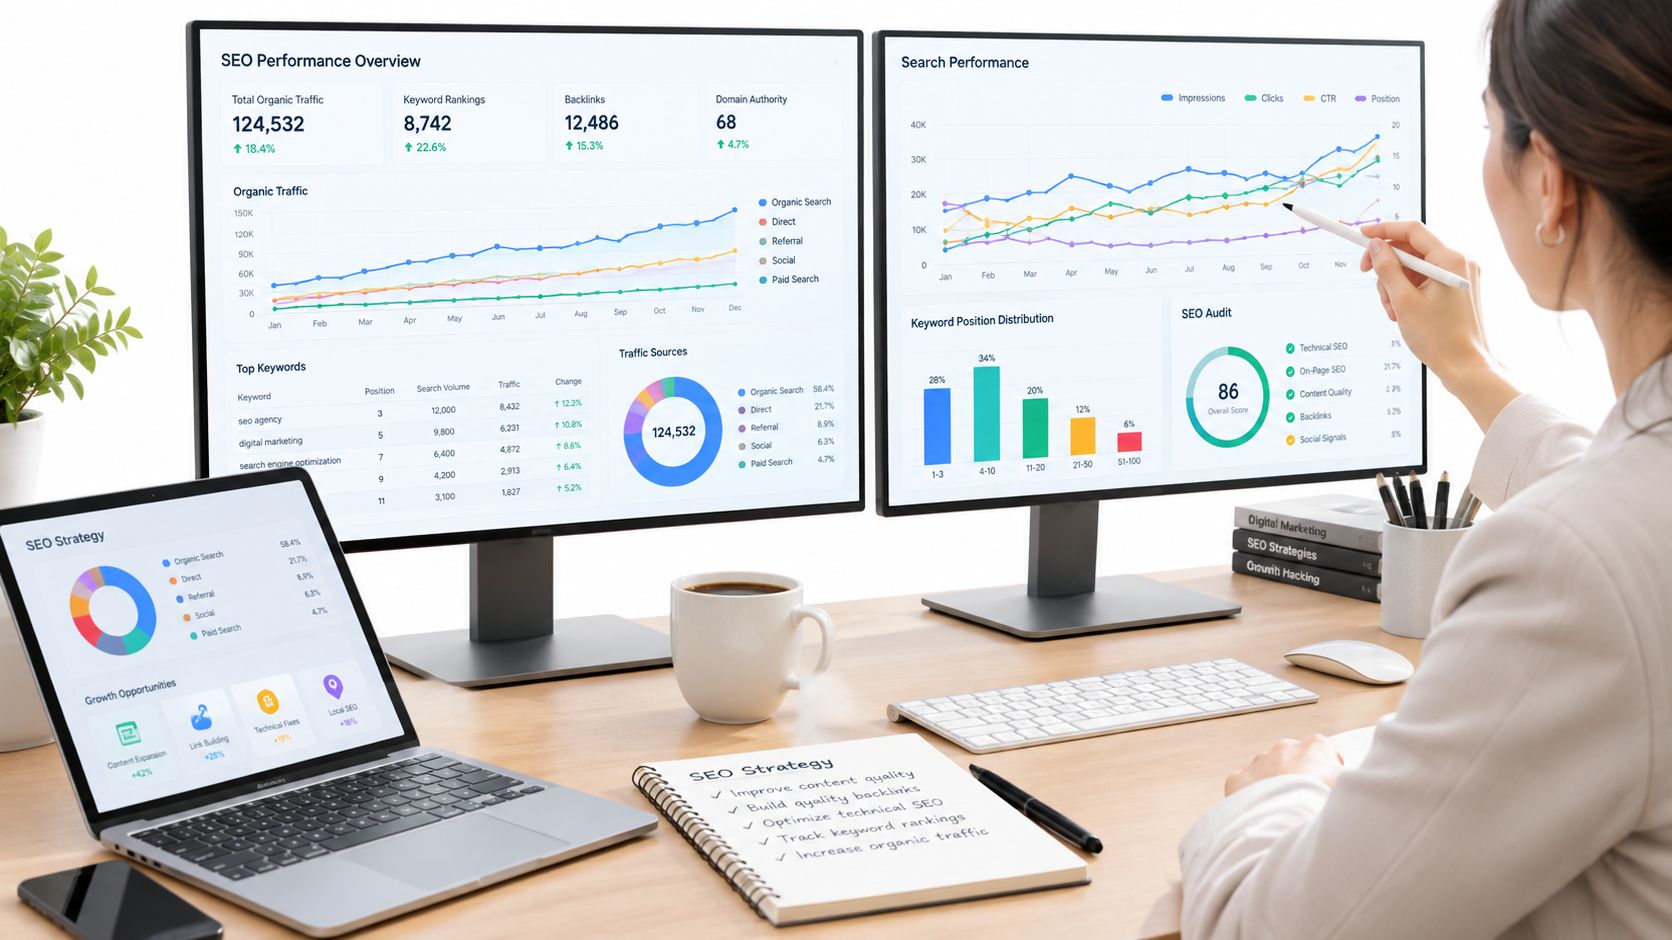
A traditional monthly PDF usually starts with the wrong question: “How did our SEO metrics move?” That invites a long list of rankings, sessions, impressions, links, and published pages without explaining which movement deserves attention. Average position might improve while valuable pages lose clicks, and organic sessions might rise because branded demand increased rather than because the content strategy worked.
I separate agency SEO reporting into three layers:
- Visibility, which shows whether the site appears in search.
- Engagement, which shows whether people select and use those results.
- Business outcomes, which connect qualified organic activity to key events, revenue, or pipeline.
Google Search Console established the practical foundation for this model. Its Performance report separates impressions from clicks, so I can distinguish reach from engagement and identify pages or queries that gain visibility without attracting visits. The report defaults to a three-month view, which gives agencies a useful cadence for reviewing month-over-month movement while avoiding conclusions based on daily volatility. Google's Search performance documentation also makes the underlying distinction clear: impressions describe appearances in results, while clicks describe user selections.
A report should change the work
The useful question isn't whether a chart looks good. It's whether the chart changes what my team or the client will do.
If impressions rise while clicks stay flat, I investigate snippets, intent alignment, SERP features, and the ranking URLs. If clicks rise but qualified leads don't, I examine landing-page relevance, tracking, and conversion quality. If revenue changes while organic sessions remain stable, I check attribution configuration and the mix of assisted and last-click conversions before claiming an SEO win.
Regla práctica: Every important metric needs a consequence. If a change doesn't affect a decision, it probably doesn't belong in the executive summary.
Client retention makes this discipline commercially important. A 2025 Agency Growth Benchmark found annual client retention of 78% among seven-figure agencies and 92% among eight-figure agencies, mientras que 70% of agency leaders considered client reporting critical to retaining retainer accounts. Those figures don't prove that reporting alone causes retention, but they show why a report has to make value visible and support the relationship around the work.
Use a cadence that reveals signal
I still use monthly reporting for most retained SEO accounts, but I don't treat the monthly PDF as the entire measurement system. Search Console's three-month default is a sensible starting point because it preserves enough context to see trends that daily movement can obscure. I annotate migrations, releases, seasonal changes, and algorithm events rather than presenting a clean line chart that hides them.
The report should open with the decision layer: the most material change, its likely explanation, the confidence level, and the next action. Supporting charts come afterward. That structure turns reporting into a recurring decision system instead of a retrospective spreadsheet.
Locking Down Attribution and Baselines
Nothing damages trust faster than a conversion spike caused by a configuration change. Before I pull a report, I freeze the reporting environment so the comparison means the same thing from one period to the next.
I start with the reporting window and timezone. Then I record the conversion definitions, eligible channels, attribution model, and lookback window in the reporting template. GA4 supports data-driven attribution, paid-and-organic last click, and Google-paid-channels last click, so a report that doesn't name its model leaves too much room for misinterpretation.
Freeze the measurement configuration
My pre-export check is deliberately operational:
- Confirm the period: Use the same date range, timezone, and comparison logic in every report.
- Verify key events: Check that conversion names, definitions, and eligibility haven't changed.
- Audit filters: Review dashboard filters, channel exclusions, segments, and landing-page selections before export.
- Check channel consistency: Confirm UTM handling and channel grouping haven't altered the way visits are classified.
- Preserve the baseline: Export the relevant Search Console and analytics data before the reporting period closes.
That last step matters because Search Console isn't an unlimited historical archive. Google provides a 16-month history in the Search performance report, with that history beginning when the relevant reporting system was introduced in March 2025. Google's Search Console data-retention documentation explains why I warehouse monthly query, page, click, impression, CTR, and position data instead of assuming the interface will preserve every baseline indefinitely.
For example, when I begin working with a site in July, I preserve that July baseline immediately. If I wait until the following July, the comparison may no longer be available in the interface. I label the date range beside every chart so the client can distinguish “no data retained” from “no performance.”
Treat attribution as a report variable
Google states that changing the reporting attribution model applies to historical and future data. The attribution-model documentation means an apparent performance jump can reflect a reporting-method change rather than a marketing result.
I learned to treat the attribution model like a configuration variable, not a cosmetic dashboard choice. If a client moves from paid-and-organic last click to data-driven attribution, the historical organic conversion total can change even when rankings, traffic, and the website remain unchanged. I mark that as a break in the time series and explain it before discussing performance.
For broader traffic context, I use this guide to monitoring web traffic alongside the locked report configuration. It helps keep collection and interpretation separate. Automation can refresh the numbers, but an agency still has to validate the inputs before turning them into a client conclusion.
Diagnosing Traffic Shifts with Precision
When a client asks why organic traffic dropped, “it's seasonality” isn't a diagnosis. It's a hypothesis that needs evidence.
I begin in Search Console, then move into GA4. Search Console clicks represent search-result selections, while GA4 organic sessions represent visits recorded in an analytics system. They won't match exactly because the systems use different counting logic, but their direction should be explainable. I investigate material gaps rather than forcing the totals to reconcile.
Google explicitly supports breakdowns by query, page, country, and device, and recommends investigating traffic declines through performance trends instead of relying on one aggregate average-position number. Search Console's troubleshooting guidance is the right operational basis for this work.
Segment before explaining
I usually split the change in this order:
- Brand status: Separate branded and non-branded queries. A branded-demand decline can look like a content failure when the underlying issue sits in awareness or market demand.
- Landing page: Find the URLs responsible for lost clicks. A site-wide average can conceal one commercial page losing visibility while informational traffic remains stable.
- Country and device: Compare markets and devices separately. A mobile-specific issue can disappear inside an all-device total.
- Intent cluster: Group queries by commercial, informational, navigational, or transactional intent. A traffic decline in low-value informational queries doesn't carry the same business meaning as a decline on product terms.
- Search surface: Keep Google Search separate from Discover and News. Mixing surfaces makes the change harder to interpret.
The most useful diagnostic is the relationship between impressions and CTR. Rising impressions with falling CTR usually points to SERP placement, snippet appeal, or intent mismatch. Falling impressions with stable CTR more often points toward demand, indexing, or ranking loss. Those are different problems, so they require different owners and remedies.
A page can also lose clicks without losing average position if the SERP changes around it. New result features, competitor improvements, or a changed query mix can alter click behavior while the reported position looks stable. That's why I inspect the query and page combinations rather than treating average position as a verdict.
Reconcile systems without inventing certainty
I set a source of truth for each KPI. Search Console owns Google search visibility. GA4 owns measured onsite sessions and key events. CRM data owns qualified pipeline or closed revenue when the integration is reliable.
I compare Search Console clicks with GA4 organic sessions directionally, then check consent behavior, landing-page tracking, redirects, channel grouping, and date settings if the gap is material. I don't present the two totals as interchangeable, and I don't use a small segment as proof of a broad trend without showing its sample size and limitations.
For teams following the wider shift in search behavior, AI Frontiers on search disruption provides useful context for why click patterns can change even when traditional ranking reports look familiar. The practical lesson is simple: diagnose the segment first, then name the cause with an appropriate level of confidence.
Reporting AI Overview Visibility Honestly
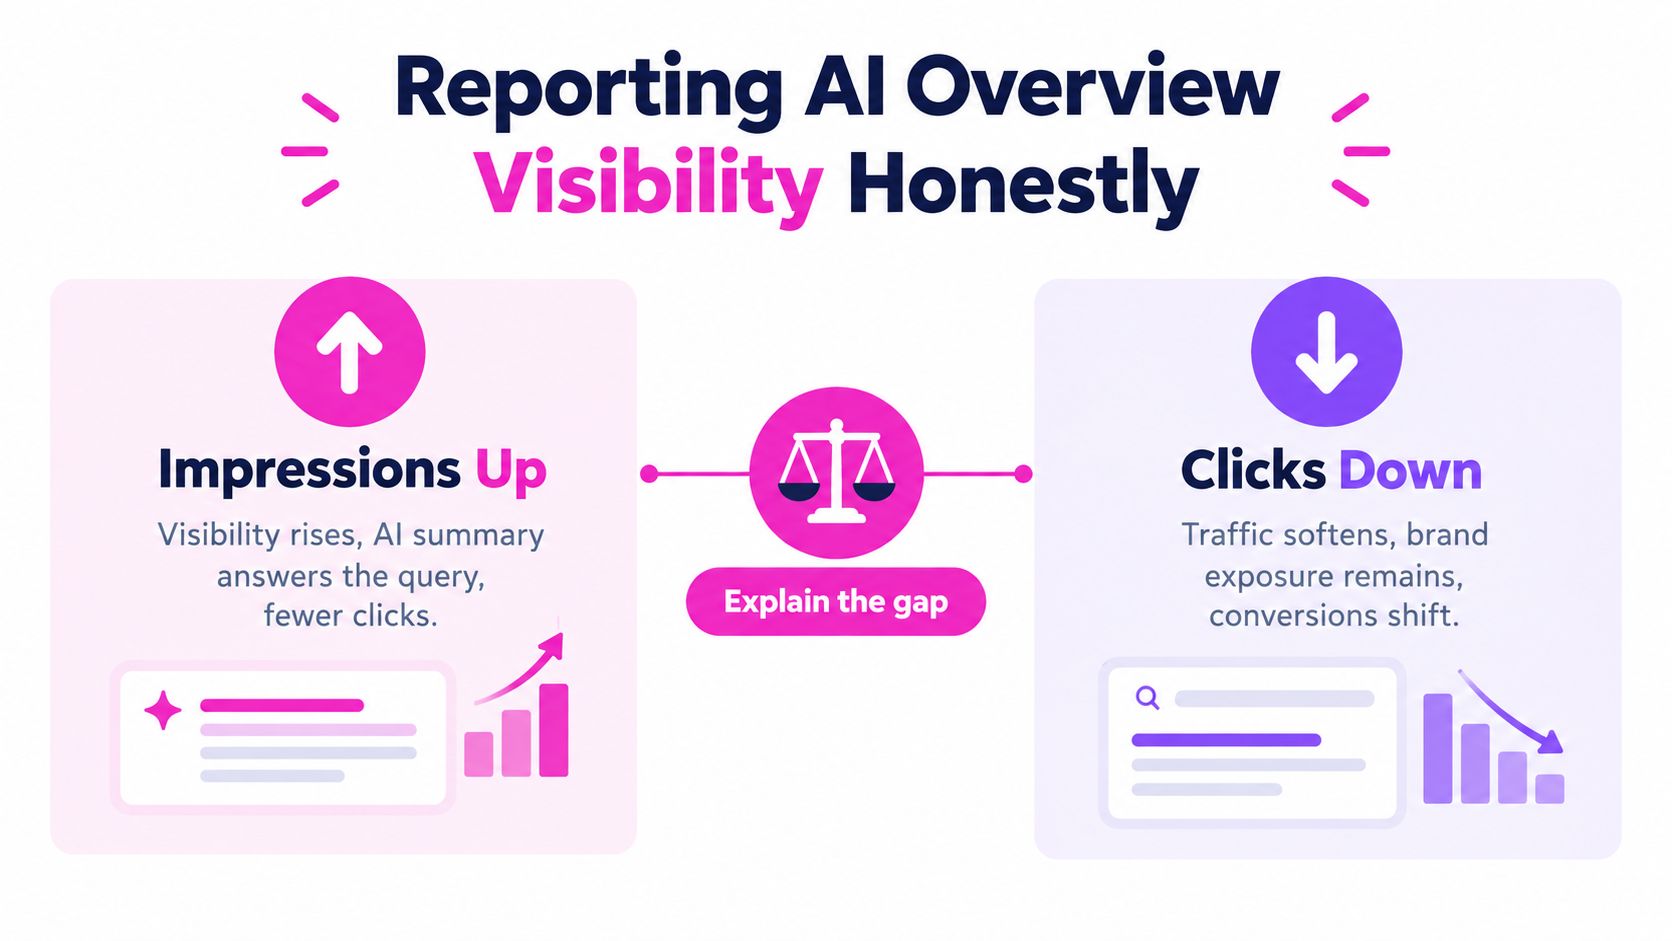
AI Overviews have broken the old assumption that greater search visibility automatically produces more visits. A client may earn a citation in an AI-generated answer while traditional-result clicks soften, and a report that combines those outcomes into one score will misrepresent both.
Pew Research analyzed 68,879 Google searches and found that traditional-result links were clicked on about 8% of searches with an AI Overview, compared with about 15% without one. Browsing sessions also ended more often when an Overview appeared. The reported Pew findings give agencies a useful reason to separate AI visibility from acquisition instead of treating a citation as a guaranteed traffic win.
I don't hide the citation, and I don't call it a conversion. I show it as earned visibility, then measure whether it correlates with branded demand, assisted activity, direct engagement, or no observable downstream change.
Add a separate AI visibility layer
For tracked queries, my report records:
- Trigger status: Whether an AI Overview appeared for the query.
- Citation ownership: Whether the client was cited.
- Cited URL: The exact page referenced in the answer.
- Citation prominence: Whether the reference appeared in a meaningful position within the answer.
- Traffic relationship: Changes in impressions, clicks, conversions, and branded behavior around the query set.
That structure prevents a common reporting error. If impressions rise and citations increase while sessions stay flat, the correct narrative may be “visibility improved, direct acquisition did not yet increase.” That isn't a failure of measurement. It's a more honest account of how the search surface now works.
The cited URL also matters. A brand citation pointing to a research page may support authority, while a citation pointing to an outdated product page creates a content and conversion problem. I use the URL to decide whether to refresh, consolidate, redirect, or improve the cited content.
A client-facing explanation needs both sides of the result. AI visibility can strengthen familiarity and influence later journeys, but attribution paths don't prove that a citation caused a sale. I label observed conversions separately from assisted or modeled influence and preserve the distinction in every reporting period. SemDash's guide to AI Overviews and SEO is a useful reference when the team needs to connect citation monitoring with broader optimization work.
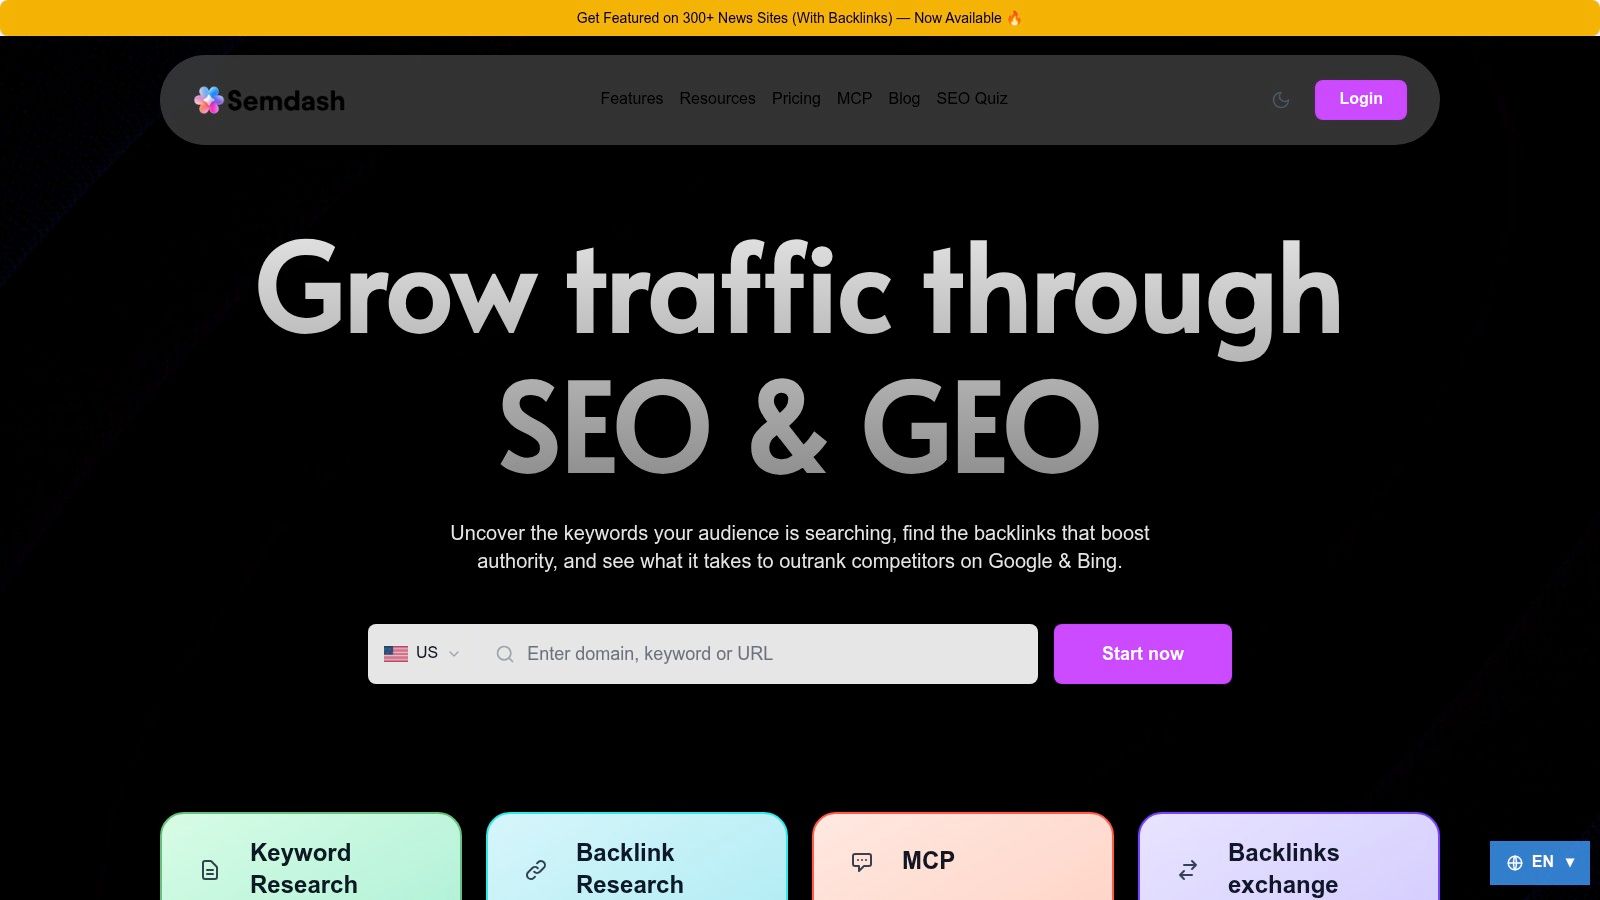
Automating Competitor Intelligence with SemDash
A client doesn't only want to know whether their visibility changed. They want to know who took the opportunity, which pages created the gap, and what the agency should do about it.
I start with a domain-level competitor comparison, then move down to keywords and URLs. The workflow is more useful than a generic “competitor traffic increased” statement because it identifies the specific topics, pages, and links associated with the change.
Move from market gap to page decision
I use SemDash as one option in the research stack for consolidating keyword, backlink, SERP, competitor, and AI Overview data. The practical workflow looks like this:
- Define the competitor set. Choose domains that compete for the client's commercial topics, not just domains with similar authority or audience.
- Run the keyword gap. Separate terms competitors rank for from terms where the client already has partial visibility. The second group often offers a faster content or optimization opportunity.
- Inspect ranking URLs. Map each important keyword to the exact page ranking for the client and competitors. This exposes cannibalization, mismatched intent, and cases where the wrong page is trying to win.
- Check the SERP history. Review historical movement and intent signals before recommending a new page. A result that looks like a content gap may in fact reflect a SERP that now favors a different format.
- Review backlink gaps. Find referring domains that link to competitors but not the client, then evaluate relevance and link context before adding outreach targets.
- Create the action register. Record the evidence, proposed action, owner, expected impact, and review date.
I don't send the raw gap export to a client. A spreadsheet of competitor terms creates work for the client instead of clarity. I reduce it to a small set of decisions, such as refresh an existing comparison page, create a missing category page, consolidate overlapping URLs, or pursue a relevant referring domain.
The same process helps explain why a metric changed. Competitor top-page analysis can reveal that a rival's growth came from one page covering an intent cluster more completely. SERP history can show that the result type changed. Backlink research can identify a new source of authority. Each finding gives the monthly report a causal hypothesis that the team can test.
I keep the recommendation separate from the certainty level. “Competitor gained visibility after launching a comparison page” is an observation if the data supports it. “Launching the same page will produce revenue” is a forecast and needs more caution.
A short walkthrough can help internal teams understand how the research becomes an action rather than another dashboard. The visual workflow below is useful when onboarding account managers or content strategists.
I review the action register at the next reporting cycle and close the loop against the original evidence. If the page improved, I record that outcome. If it didn't, I revisit intent, internal linking, technical constraints, or the quality of the original hypothesis. That feedback is what makes competitor intelligence operational rather than decorative.
Building Exception-Based Action Registers
The report's final question should be, “What changes because of this information?” If the answer is unclear, the report is still a dashboard with commentary.
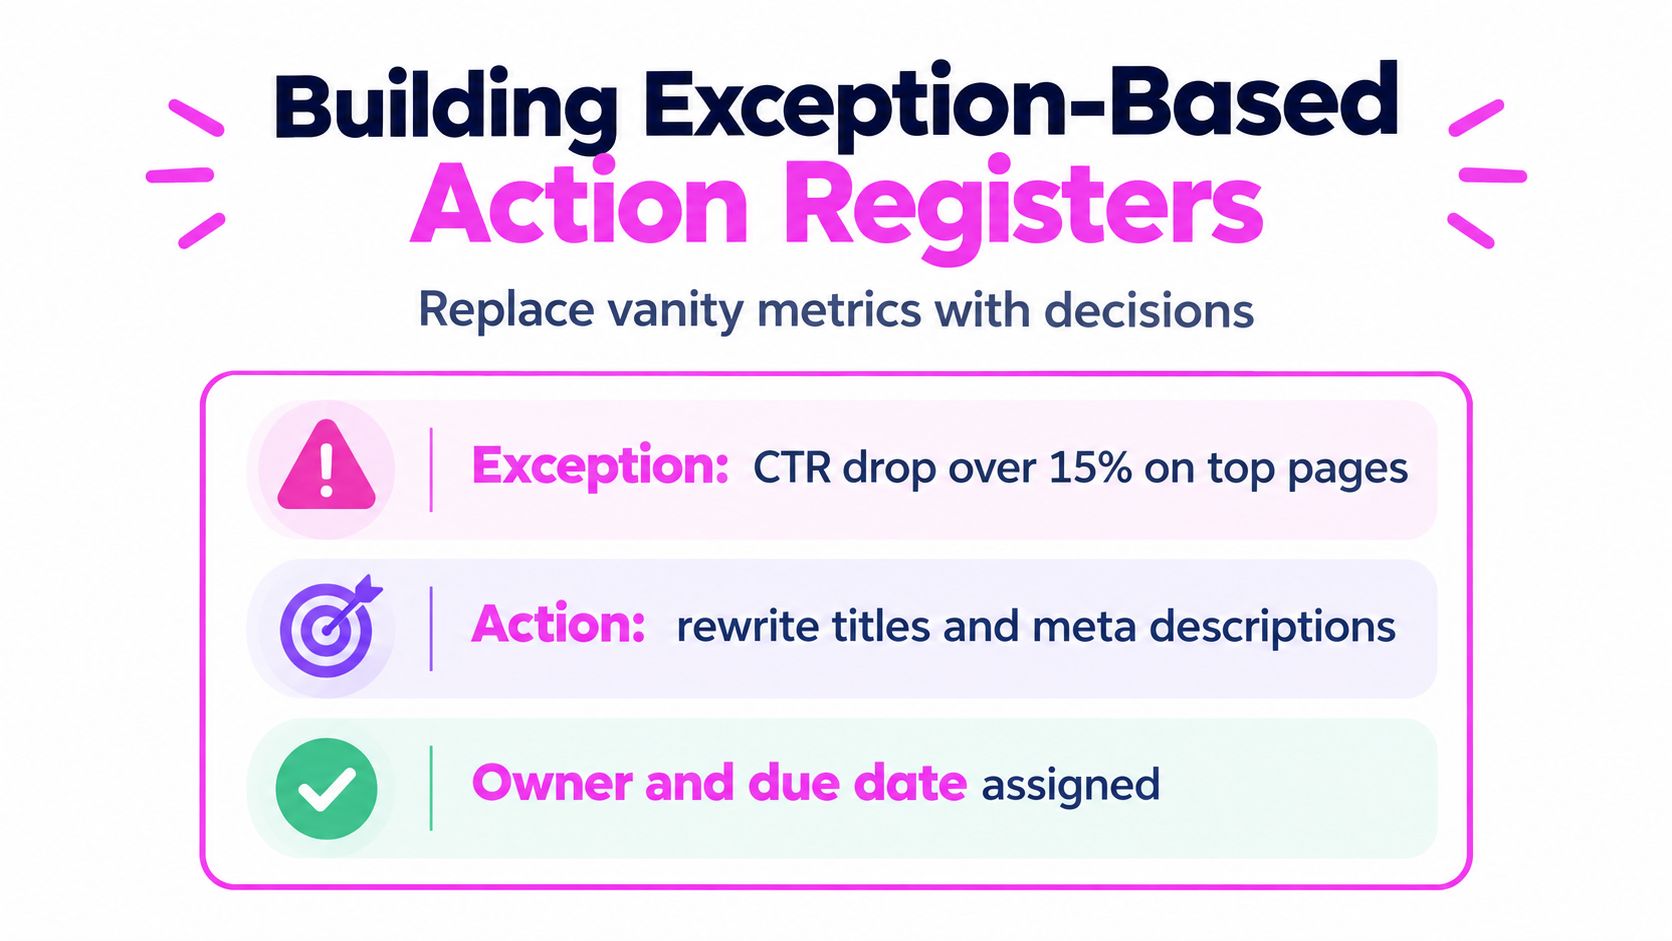
I replace the standard KPI summary with an exception-based action register. The register filters for material changes and gives each one a response. A useful exception might be a high-value page losing clicks while position remains stable, a competitor gaining visibility across an important topic, a ranking URL changing unexpectedly, or a valuable referring domain appearing in a backlink gap.
Give every exception an owner
I use four fields for each item:
- Observed change: State what moved, where, and during which period.
- Interpretation: Explain the strongest supported cause and identify uncertainty.
- Recommended action: Specify the work, such as rewriting a title, fixing indexing, consolidating pages, or testing a new content angle.
- Ownership and review: Name the person responsible, expected impact, evidence required, and date for reassessment.
This format keeps leading indicators useful without pretending they are business outcomes. Published content, indexed pages, referring domains, and ranking coverage can show whether the program is moving, but the report should connect them to qualified sessions, key events, revenue, or pipeline where tracking supports that connection.
A client may ask why the report doesn't show every ranking movement. My answer is that attention is limited, and a complete export can obscure the few changes that deserve a decision. I still retain the detailed data for analysis, but I put exceptions in front of stakeholders.
Recent agency benchmark findings report that 55% of agencies regularly hear clients ask whether marketing performance can be connected to revenue, mientras que 36% say clients want more proactive insights rather than data alone. The agency benchmark findings reinforce the commercial case for this format. The client isn't asking for fewer facts. They're asking for a clearer connection between evidence and action.
The strongest monthly report doesn't prove that every activity worked. It proves that the agency knows what changed, what it means, and what it will do next.
I finish with a short list of decisions, not a closing chart. If tracking has a defect, it comes first. Then I address indexing and ranking issues, followed by CTR and content experiments. That ordering prevents the team from optimizing snippets while the measurement layer is broken.
SemDash brings keyword, backlink, SERP, competitor, URL-level, and AI Overview research into one workspace, which makes it practical for building reports around evidence and next actions rather than disconnected exports. Use SemDash to turn the next client report into a prioritized action register, then invite your team and client to review what should happen next.